Data Visualisation - Don't just present the data, tell its story
What is Data Visualisation
Now more than ever before we have the data to assist our businesses to
plan for the future and set an effective course to get us there. Often
this information is presented inappropriately where the audience is left
uninspired or, worse, confused as to what the information is telling
them.
Data visualisation isn’t just about the format of your graphs and
charts is about how to correctly analyse data and decipher its meaning
and then how to ensure that meaning is translated to your audience.
Before you analyse and develop your data presentation in the same old
tried, tested, and failed manner, why not go to the next level and
present your data in a manner that provides the reader with certainty of
data interpretation. Data visualisation is about using data to present a
clear story the audience can grasp quickly and understand without
further anecdotal explanation.
Course Objectives
During the workshop we will focus on:
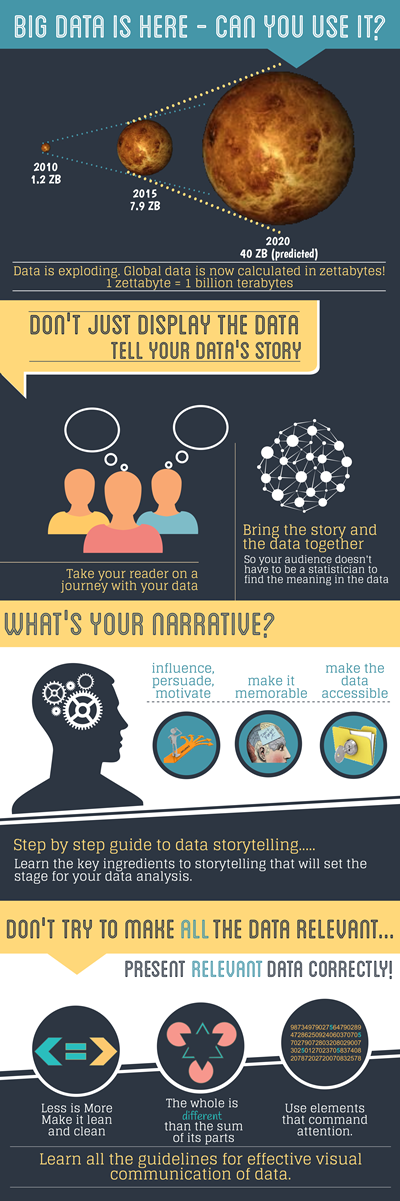
Step by step guide to data storytelling - Learn the key ingredients to storytelling to set the stage for your data analysis.
Identifying the relevant data to present - Don’t try to make all the data relevant, present the relevant data correctly.
Choosing the right tool for the job - Know when to use which graph depending on the message you are trying to convey.
Draw attention to the message within the data - The whole is different to the sum of its parts - show it!
Course Format
The short-course format is designed to provide you with a basic
foundation to start you on your data visualisation journey. The course
duration is 3.5 hours. In the first half of the course we will focus on
the learning objectives. In the second half we will workshop the
learnings and apply them to fictional scenarios.
It is recommended that attendees sign up for the optional extra*
to help work through their specific data visualisation needs. Often,
working through a dataset that is personal and known to the participant
assists in cementing the course learnings.
Enrolment Information
Date: Friday 14 August, 2015
Time: 9am -12.30
Location: Suite 114, Level 1, 147 Pirie Street, Adelaide
Cost per person: $300* plus gst, includes morning coffee.
contact: Steph Jeuken
email: steph@oztrain.com.au or
mobile: 0429 040 733
*Optional extra:
One hour person to person with Steph following the workshop to discuss
real reports with which you are working. Cost $400 plus gst. Or book the
two together for a package price of $600 plus gst.
To view a larger version of the infographic click here:
http://oztrain.com.au/wp-content/uploads/2015/07/Data-Visualisation-Short-Course-Infographic.png